Spain Population Pyramid 1950
Year
1950Spain in 1950
In 1950, Spain had a total population of 28,077,048 people. Half of the population was younger than 27.5 years; 26.5% were children under 15 and 7.2% were 65 or older.
This is a stationary pyramid — similar numbers in each age group up to the older cohorts, the signature of near-replacement fertility.
Data source: United Nations World Population Prospects, 2024 revision (medium variant) — last updated July 2024.
The fertility rate of Spain was 1.12 births per woman in 2023, under the 2.1 needed to replace each generation.
Source: World Bank World Development Indicators, latest available year.
A child born there in 2023 could expect to live 83.9 years on average (86.7 years for girls, 81.2 for boys).
Source: World Bank World Development Indicators, latest available year.
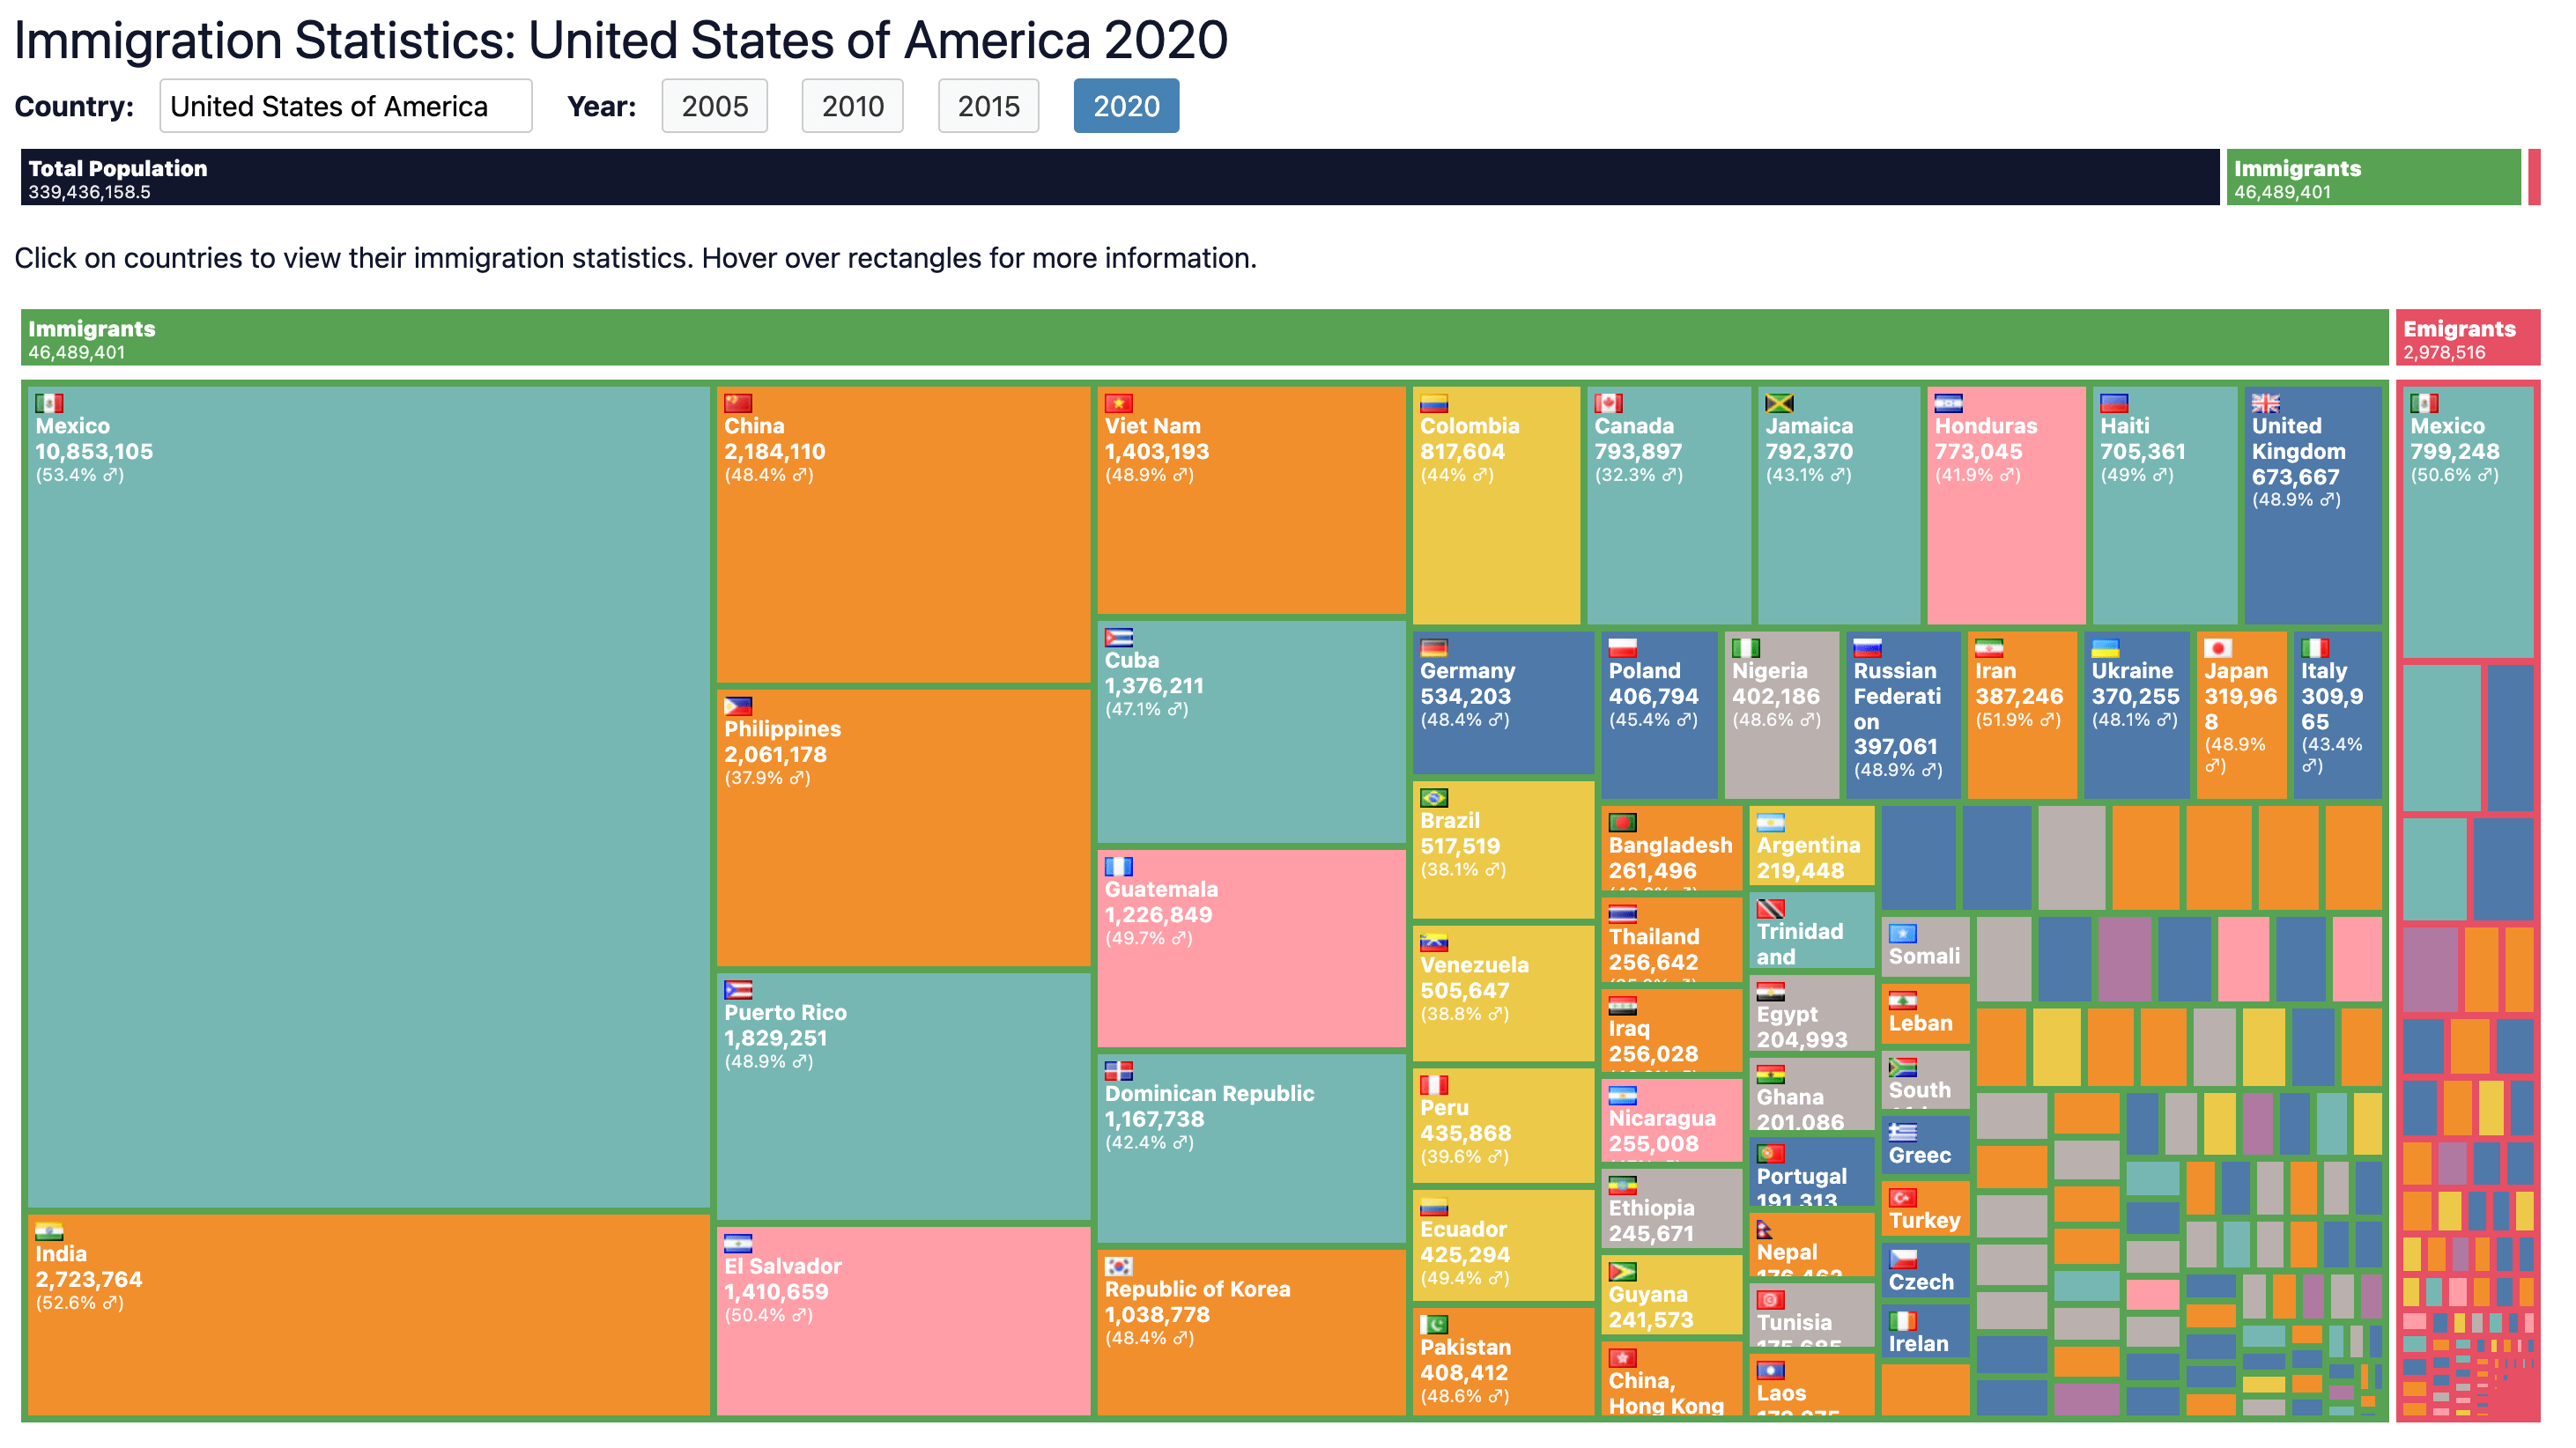
8,305,043 immigrants live in Spain, 17.3% of the population.
| Morocco | 1,088,408 |
| Colombia | 792,228 |
| Venezuela | 602,539 |
| Romania | 522,578 |
| Ecuador | 432,111 |
1,597,508 people born in Spain live in other countries.
| France | 254,830 |
| United Kingdom | 211,894 |
| United States of America | 168,755 |
| Germany | 166,899 |
| Romania | 85,101 |
Source: United Nations International Migrant Stock 2024.
| Country | Population | Median age | Relative size |
|---|---|---|---|
| Spain | 28,077,049 | 27.5 | |
| Italy | 46,391,674 | 28.6 | |
| Portugal | 8,418,877 | 26.1 | |
| Greece | 7,651,079 | 25.7 | |
| Serbia | 6,009,201 | 25.5 |