Population Pyramids of the World from 1950 to 2100
What is a population pyramid?
A population pyramid is a chart that shows the distribution of a population by age group and sex: males on the left, females on the right, with the youngest age groups at the bottom and the oldest at the top. Its shape reveals at a glance whether a population is young and growing, ageing and shrinking, or roughly stable. Learn how to read one →
World in 2026
As of 2026, the World counts an estimated 8,300,678,396 inhabitants. A decade earlier, in 2016, the population was 7,558,554,526; it has grown by 9.8% since.
The median age is 32.1 years, and for every 100 people of working age (15–64) there are 36.9 children under 15 and 16.2 people aged 65 or over. The near-vertical sides of the pyramid indicate a stationary age structure, with births roughly balancing the passage of cohorts into older age.
Data source: United Nations World Population Prospects, 2024 revision (medium variant) — last updated July 2024.
The World Bank does not publish this indicator for regions or continents.
The World Bank does not publish this indicator for regions or continents.
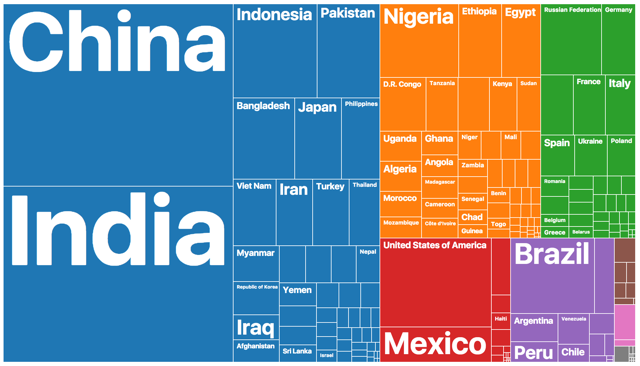
281,808,905 immigrants live in World.
| India | 18,533,845 |
| China | 11,701,619 |
| Mexico | 11,596,529 |
| Ukraine | 9,769,216 |
| Russian Federation | 9,134,094 |
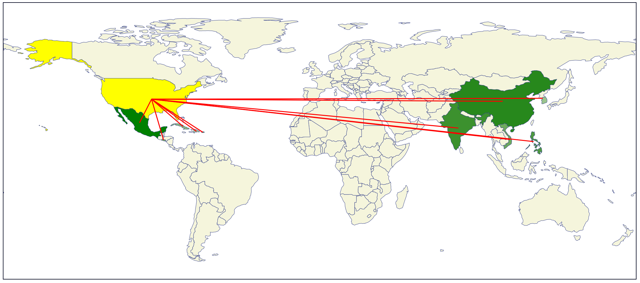
303,611,211 people born in World live in other countries.
| United States of America | 52,375,047 |
| Germany | 16,750,084 |
| Saudi Arabia | 13,683,841 |
| United Kingdom | 11,845,479 |
| France | 9,186,757 |