World Population Pyramid 1990
World in 1990
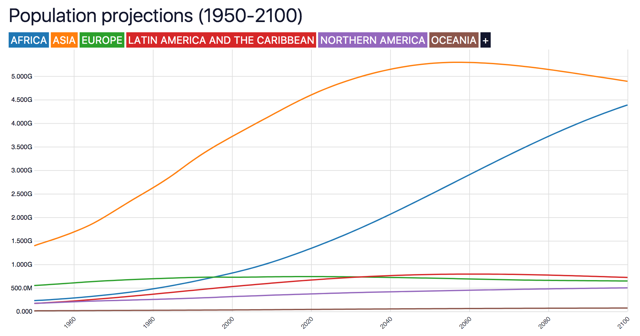
The population of the World in 1990 was 5,327,803,110. A decade earlier, in 1980, the population was 4,447,606,236; it has grown by 19.8% since.
With a median age of 24.0 years, the World had a youth dependency ratio of 54.2 and an old-age dependency ratio of 10.0 per 100 people of working age. The broad-based, expansive shape of the pyramid points to high fertility and strong population growth.
Data source: United Nations World Population Prospects, 2024 revision (medium variant) — last updated July 2024.
The World Bank does not publish this indicator for regions or continents.
The World Bank does not publish this indicator for regions or continents.
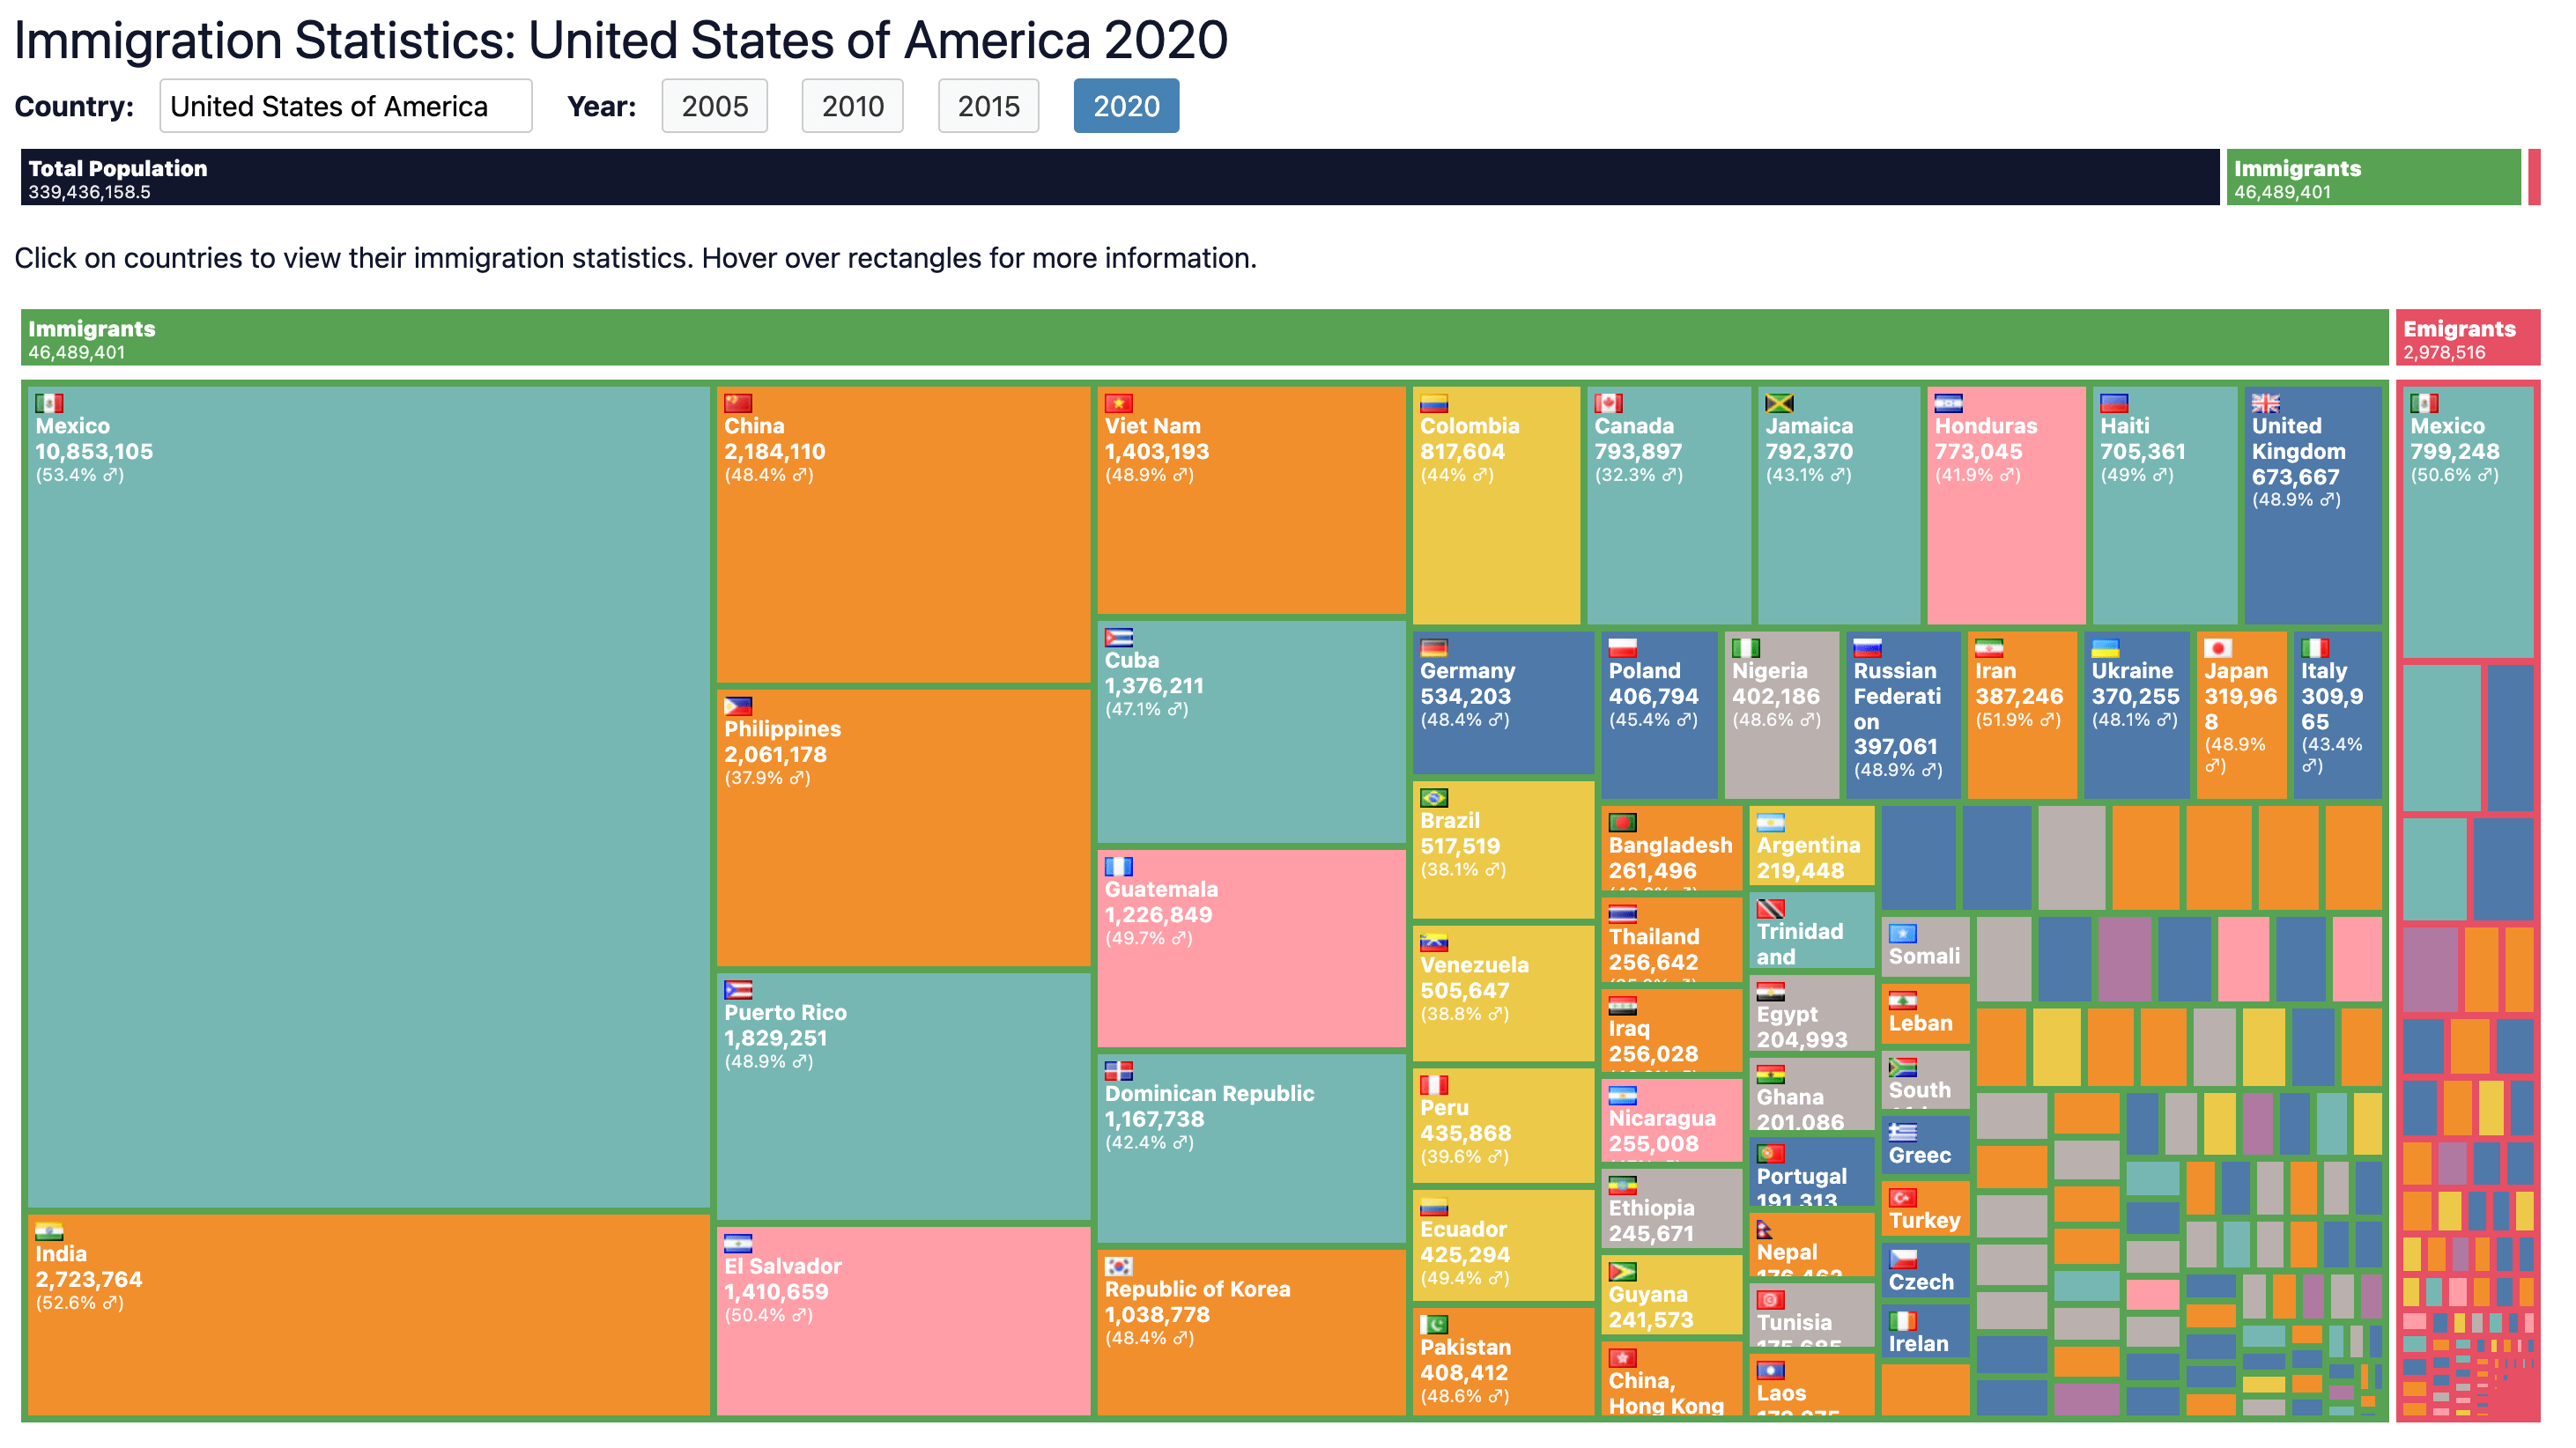
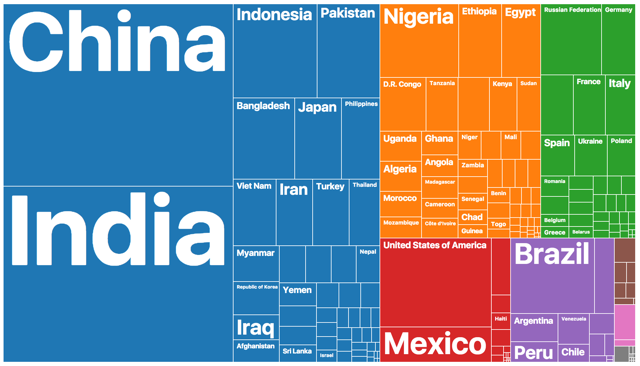
281,808,905 immigrants live in World.
| India | 18,533,845 |
| China | 11,701,619 |
| Mexico | 11,596,529 |
| Ukraine | 9,769,216 |
| Russian Federation | 9,134,094 |
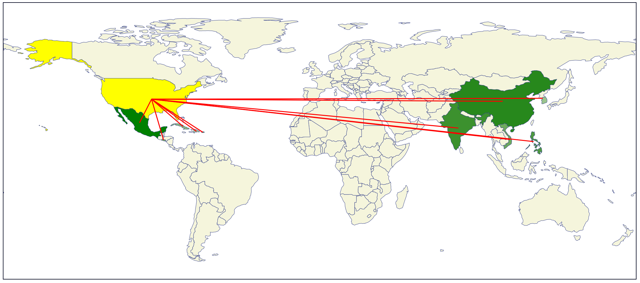
303,611,211 people born in World live in other countries.
| United States of America | 52,375,047 |
| Germany | 16,750,084 |
| Saudi Arabia | 13,683,841 |
| United Kingdom | 11,845,479 |
| France | 9,186,757 |