Asia Population Pyramid 2050
Asia in 2050
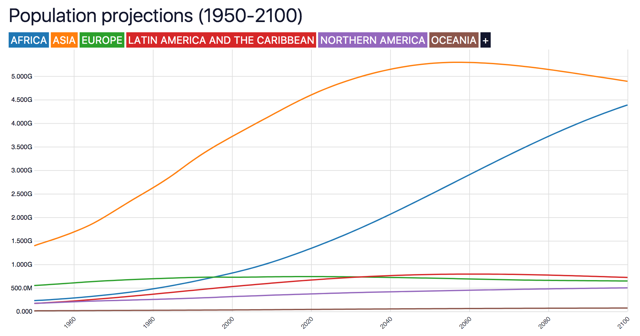
In 2050, Asia is projected to have a population of 5,280,378,400 people. That would be 2.0% more than in 2040 (5,174,593,428).
With a projected median age of 40.8 years, Asia would have a youth dependency ratio of 26.9 and an old-age dependency ratio of 29.1 per 100 people of working age. This is a constrictive pyramid — its base is narrower than its middle, the signature of sustained low birth rates and population ageing.
Data source: United Nations World Population Prospects, 2024 revision (medium variant) — last updated July 2024.
The World Bank does not publish this indicator for regions or continents.
The World Bank does not publish this indicator for regions or continents.
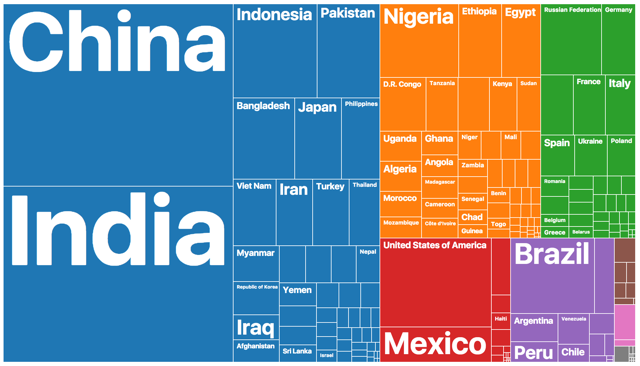
87,148,971 immigrants live in Asia.
| India | 11,191,140 |
| Bangladesh | 7,623,477 |
| Syrian Arab Republic | 6,847,008 |
| Afghanistan | 6,236,047 |
| China | 6,129,789 |
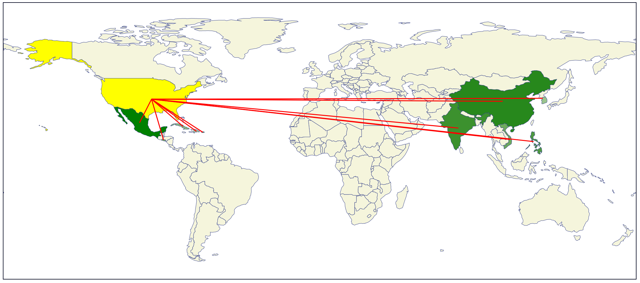
120,763,610 people born in Asia live in other countries.
| United States of America | 14,986,309 |
| Saudi Arabia | 10,771,775 |
| United Arab Emirates | 6,794,566 |
| Turkey | 5,315,680 |
| Germany | 4,744,443 |